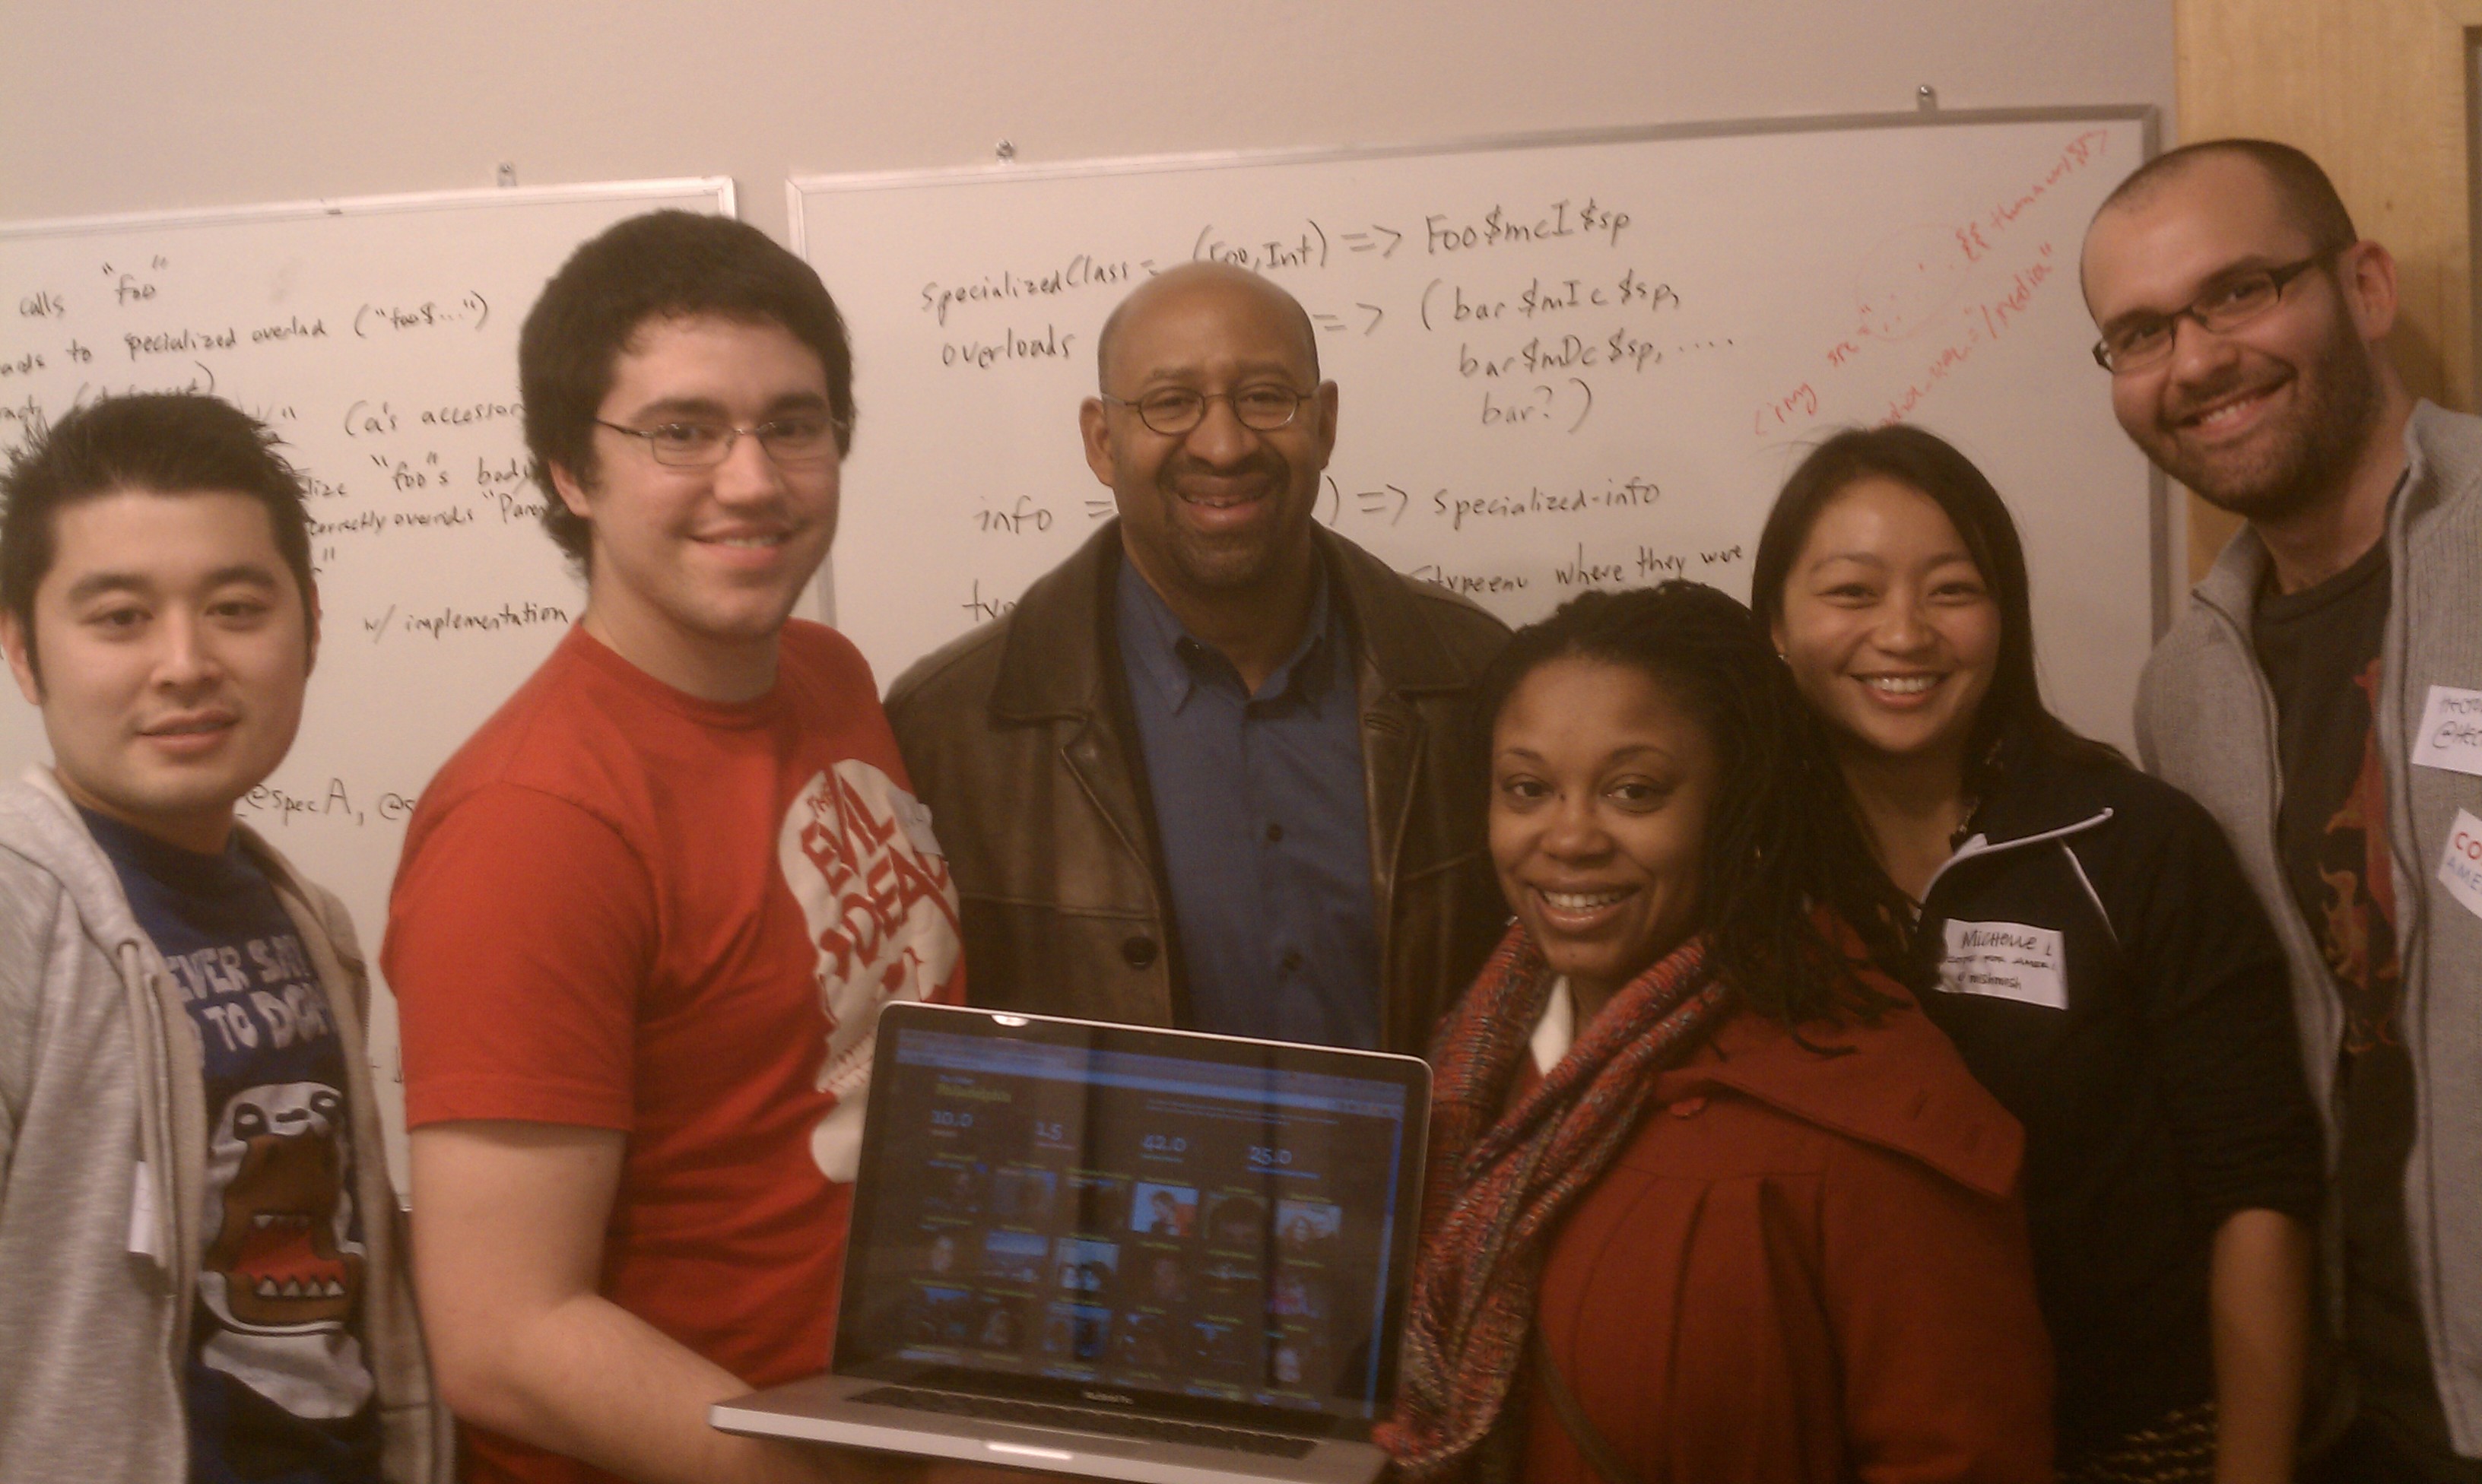
This past weekend I attended the Code for America event held at Azavea’s offices around 12th and Callowhill. Their office was spacious and well accommodated, but the wireless was slow during the day.
I met a coworker, Hector, there and had some coffee and breakfast. We didn’t really get started until at least quarter of ten, a bit late. Organizers passed out Post-It notes for us to write down ideas. Various people involved in city government and other civic organizations took turns presenting their ideas of projects to work on. I took notes as best I could and when they were done, we discussed which seemed most interesting to work on. People were encouraged to stick the ideas written down onto a whiteboard at the front of the room. Half of the participants helped to group the ideas by topic.
Hector and I talked again about what to work on. Organizers meanwhile passed out colored dot stickers to use in voting for ideas. Once the herd thinned out, we voted as well. Once the voting was complete, 8 main topics/ideas were selected and participants self-selected into those different groups. We considered working on a project to make lobbyist information accessible, but decided to work on a project to publicize statistics about the plight of the more downtrodden areas of the city.
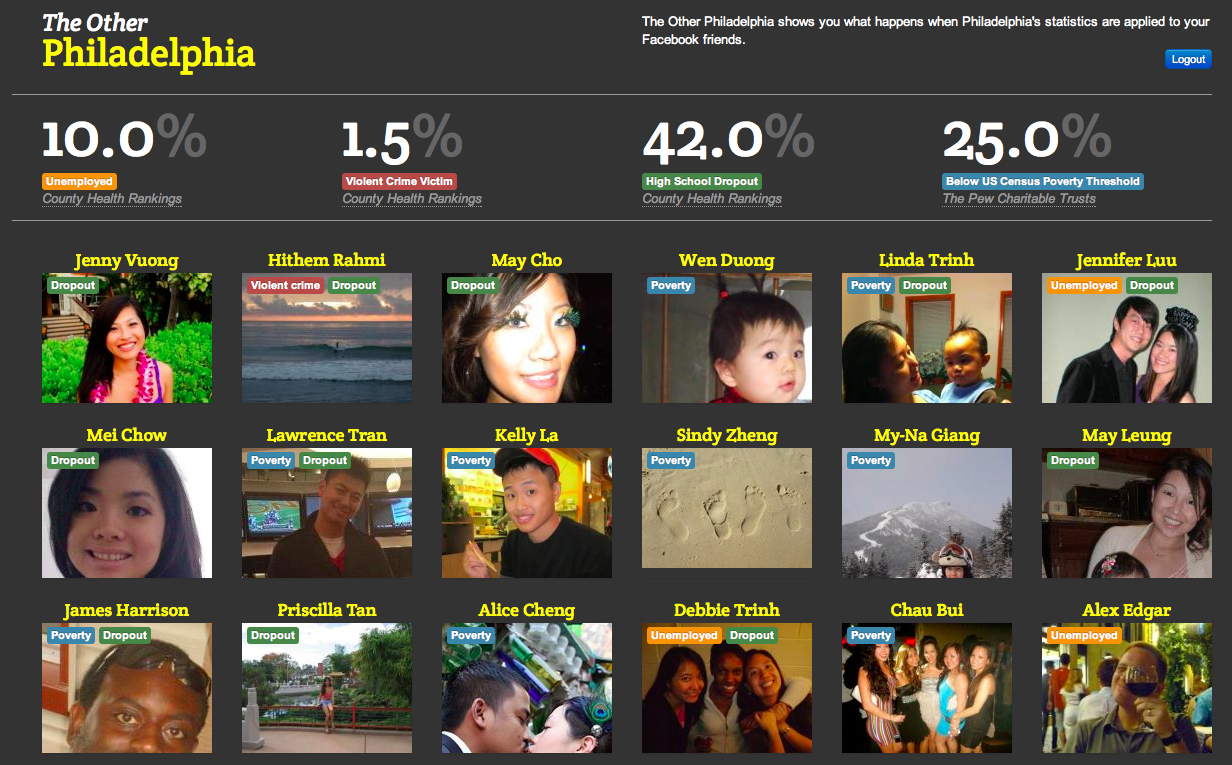
Originally, the concept was to take statistics about the city such as crime and poverty rates, and relate them to a person through their neighborhood. Someone would enter either their zipcode or various other statistics about themselves (perhaps highschool class size), and the site would use that information to give them a statistic like:
If you lived in Philadelphia, only 58 of the 100 students in your class would’ve graduated.
or
If you lived in Philadelphia, 3 of your 200 neighbors would’ve been the victim of violent crime.
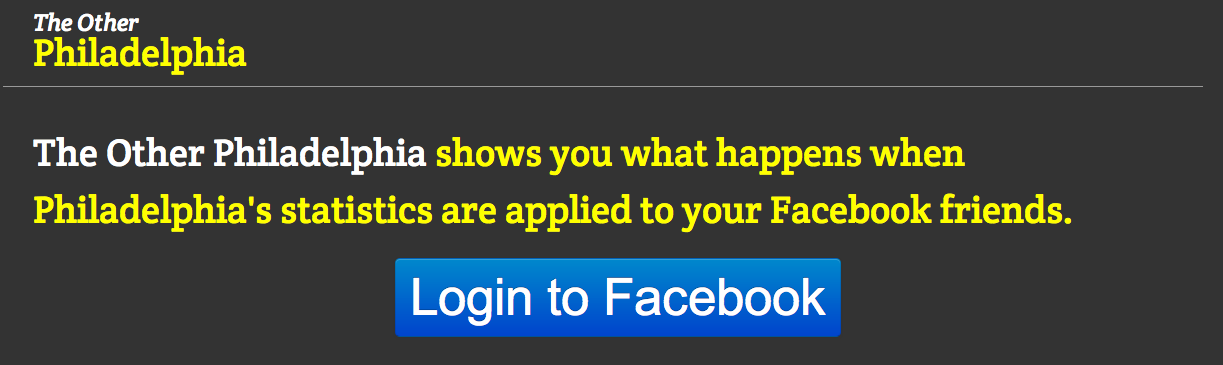
We discussed this concept with other people, and someone suggested this type of site might make someone glad they didn’t live in Philadelphia rather than promote civic engagement. This helped to lead to the concept that we eventually ran with. We decided that we should use people’s friends to illustrate the statistics.
So, we went to work implementing Facebook authentication, querying the Graph API, designing the site views, and writing code. I mostly paired with Hector and focused with him on the Graph API. We needed to retrieve friend names and profile pictures. We worked on various other pieces such as sampling friends for the statistics, wiring up the views, and pushing to Heroku.
We had some last minute difficulties shortly before our demo, including:
- Heroku having limited functionality for the free-app tier
- Problems connecting the site on Heroku with the Facebook app
- Wireless network issues
In case you’re wondering, the project that won first price was //lobbying.ph/, the site that provides information about Philadelphia’s registered lobbyists. Technically Philly has a writeup about the event. You can find our presentation on Viddler.